You may know by now that NMT is an excellent tool for measuring physiological functions, but what kind of different tests can you do to get that information? Here are some examples of 3 types of NMT tests: stimuli, simultaneous, and profiling.
Biotic and/or Abiotic Stimuli
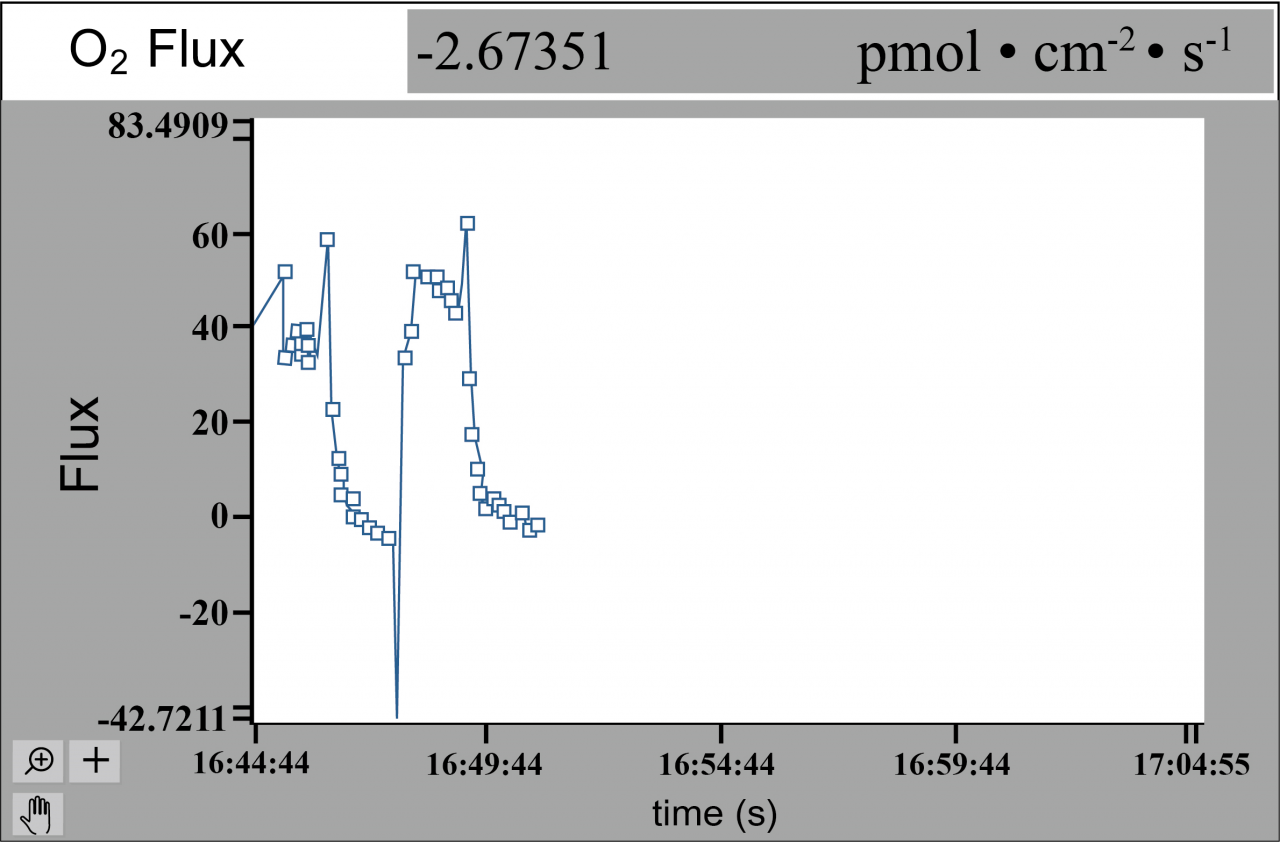
This picture shows raw NMT data; this is what you might see unfolding before your eyes during an experiment using NMT. In this test, we are measuring oxygen from a leaf sample, which at times is being stimulated by a bright light to trigger photosynthesis. At the start of this test, the light is on and you can see strong efflux as oxygen is produced by the reaction. When the light is turned off, oxygen production falls to about zero.
Intervention during testing provides incredibly valuable data, whether your intervention is light, drugs, or other stressors. By adding a stimulus during testing, you will be able to see the sample's physiological reaction unfold in real time in the form of changing ion/molecule fluxes.
Learn more in this video: https://www.youtube.com/watch?v=YuWYflvuIK0
Simultaneous Testing
This is a great example of a simultaneous cancer metabolism test that was done in our lab. A local hospital donated breast tumor tissue from a real patient for the experiment. While keeping the sample in a liquid solution made to best mimic its normal environment, we measured H+ and O2 fluxes simultaneously.
From the resulting data, you can see how the fluxes relate to one another. This is one of many reasons why measuring fluxes simultaneously is so powerful!
Flux Profiling
You can also use NMT to create a flux profile. Since NMT sensors measure in situ, you can choose a specific point around your sample to measure fluxes. Then you measure flux at several points and put them all together to create a flux profile. Shown in the picture is an H+ flux profile of an Arabidopsis root. Since roots have different zones that serve different functions, you can easily see with NMT how each zone behaves with regards to a certain ion or molecule compared to the other zones. This Arabidopsis root profile revealed lots of H+ influx at the tip (shown in blue), but as we moved further from the tip we started to see H+ efflux (shown in red).
Experience the NMT Physiolyzer® Our most advanced NMT system yet: This highly advanced instrument is allowing scientists to discover physiological functions of live samples in innovative new ways. With customizable software, you can choose from 14 ions and molecules for your own personalized system.
The Theory of NMT Check out the principles of how NMT works.


